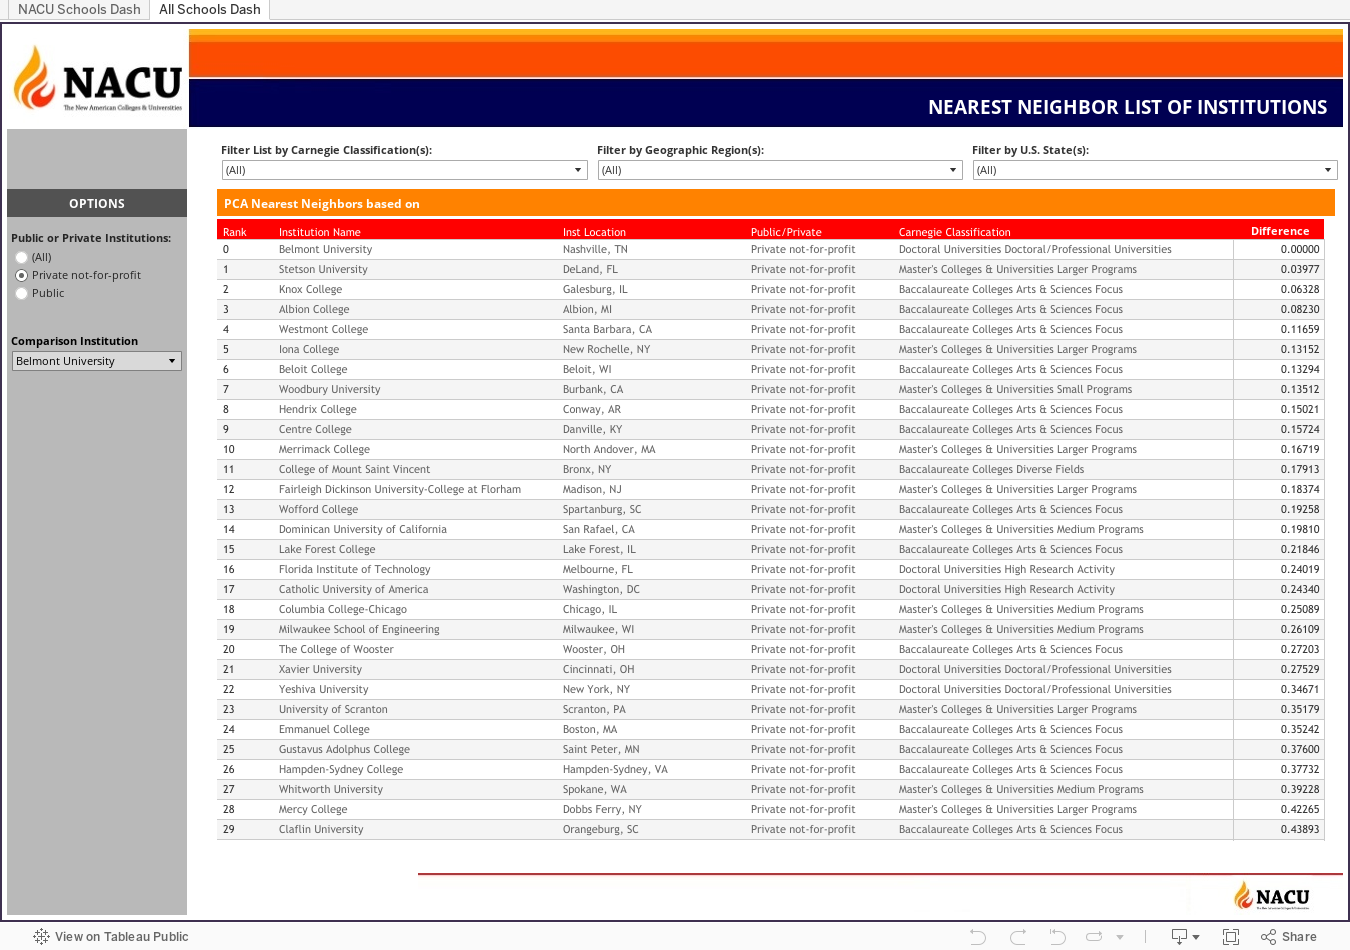
The Comparison Dashboard provides a view of institutional similarity using a principal component analysis (PCA) of more than 30 IPEDS variables*. There are two tabs in the top left. The first one compares NACU institutions against each other. You can select a focus institution and then the report will sort the remaining NACU campuses by order of similarity. The second tab allows you to select a focus institution to be compared against all institutions (both NACU and non-NACU).
*IPEDS variables used:
- Enrollment:
- Total
- Student FTE
- Total Undergraduate
- Percent Undergraduate
- FT Undergraduate
- Percent FT Undergraduate
- Percent Undergraduate Minority
- Percent Undergraduate Male
- Total Graduate
- Percent Total Distance Education
- Student Outcomes:
- Freshman-to-Sophomore Retention Rate
- 6-year Graduation Rate
- Admissions:
- Percent of Applicants Accepted
- SAT Math Score (75th Percentile)
- Financial (consumer)
- Cost of Attendance (Out of State)
- Tuition & Fees (Out of State)
- Average First-Year Cohort Institutional Grant Aid Amount
- Percent of Undergraduates Receiving a Pell Grant
- Financial (institutional)
- Debt-to-Asset Ratio
- Total Institutional Expenses
- Total Institutional Revenue
- Institutional Revenue from Tuition & Fees
- Institutional Revenue from Tuition & Fees Per Student FTE
- Institutional Expenses – Instruction Per Student FTE
- Endowment
- Endowment Per Student FTE
- Personnel
- Total Employees
- Total Employees FTE
- Total Faculty
- Faculty FTE
- Student to Faculty Ratio
- Student to Staff Ratio